One advisor for every database you run
Your database is trying to tell you something. InsightrAL™ makes sure you hear it.
Slow queries, creeping bloat, blocked sessions, a migration that quietly broke something. insightral watches every database you run and tells you in plain language what’s wrong, why it matters, and how to fix it — then routes it to the right owner. Your data and credentials never leave your network.
PostgreSQL · Oracle · MySQL · SQL Server · MongoDB — see it on your own databases in minutes.
5
database engines
Co-depth flagships — not a Postgres tool with adapters bolted on.
129
deterministic checks
Rules written per engine for the failure modes that engine actually has.
60+
MCP tools
Your AI copilots call insightral directly — read-only by default.
0
credentials handed over
The agent holds your DSN locally. Insights leave; data doesn't.
Detect
Deep, explainable checks catch the problems hiding in every database you run.
Explain
Plain-language cause and fix for each issue — on the AI model you choose.
Act
Page the right people, open the incident, and track it to a closed fix.
Protect
A read-only agent — your data and credentials never leave your network.
Inside the product
Four screens that do the work of a war room.
Real captures from the running product — the fleet, a finding, the shape of your schema, and the path from a slow endpoint to the change that caused it.
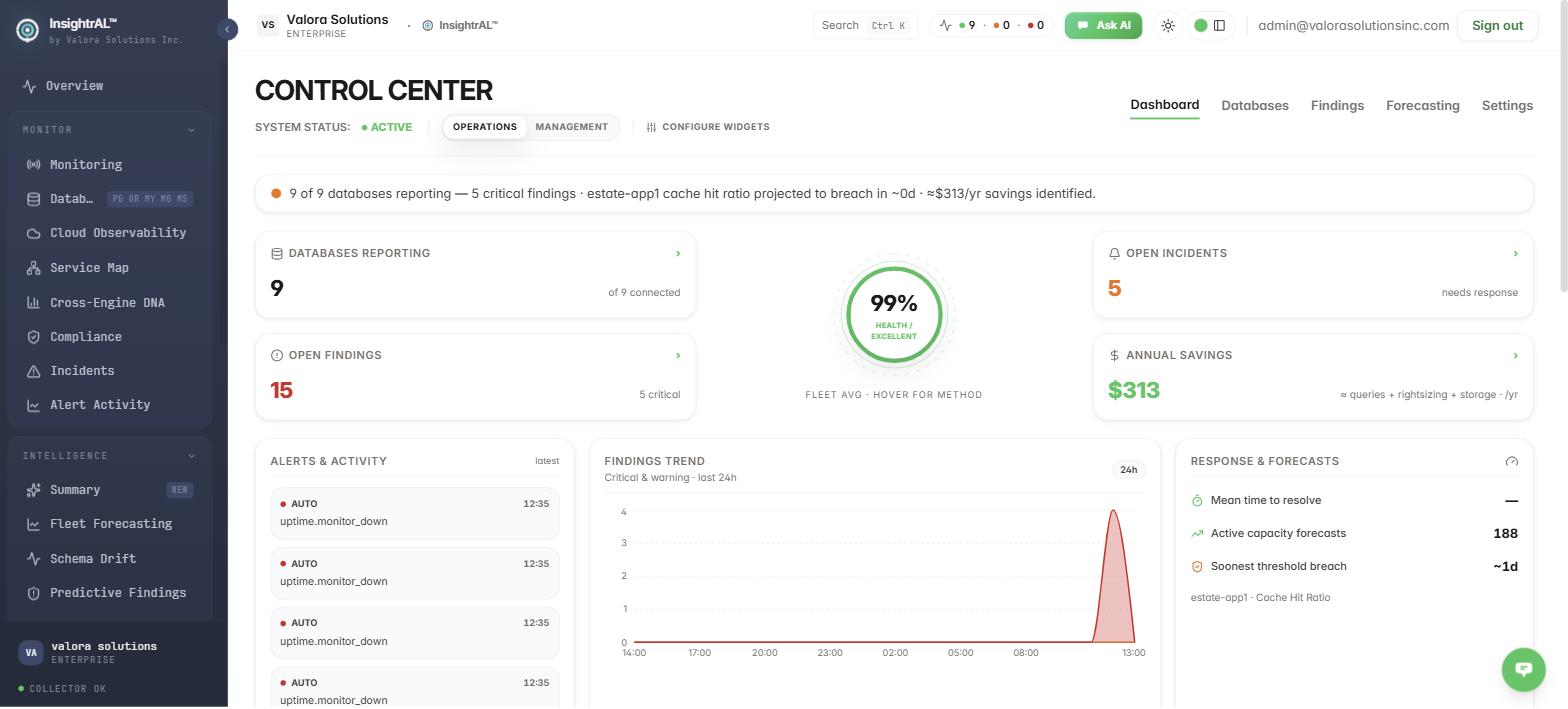
The fleet
Every database you run, on one page.
Postgres, Oracle, MySQL, SQL Server, and MongoDB side by side — health, open findings, and what changed, without a dashboard wall per engine. Drill from the fleet into a single database without losing the thread.
- One inventory across engines, environments and clouds
- Severity roll-up per database, not a raw alert feed
- Per-engine detail views written for that engine's failure modes
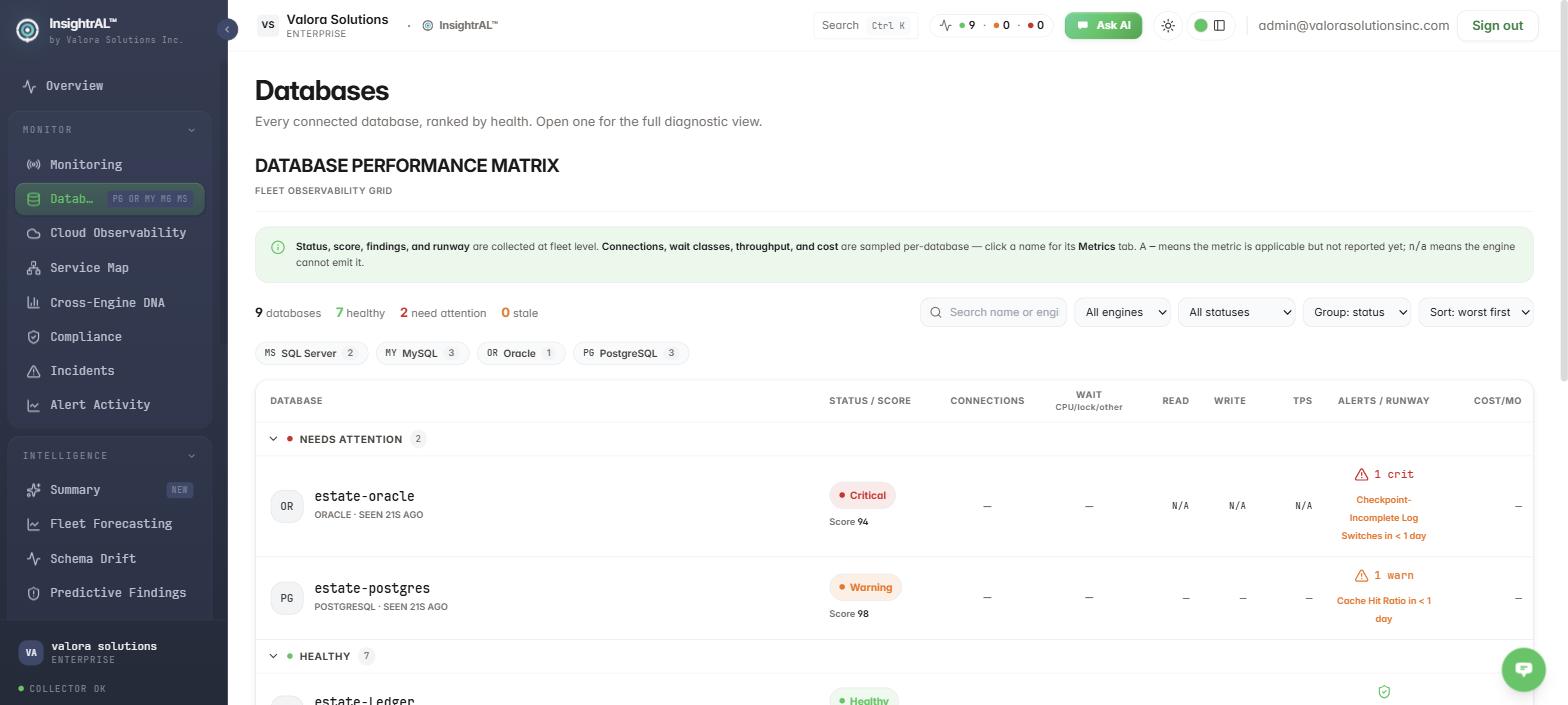
A finding
Not an alert. A fact, with the evidence attached.
Each finding carries the observation that produced it, why it matters on this database, and the change to review before you run it. Clear enough to paste into a ticket — or hand to the owner who has to act on it.
- Evidence and affected object shown with the finding
- A reviewable remediation, never an unattended change
- Routed to the right owner and tracked to a closed fix
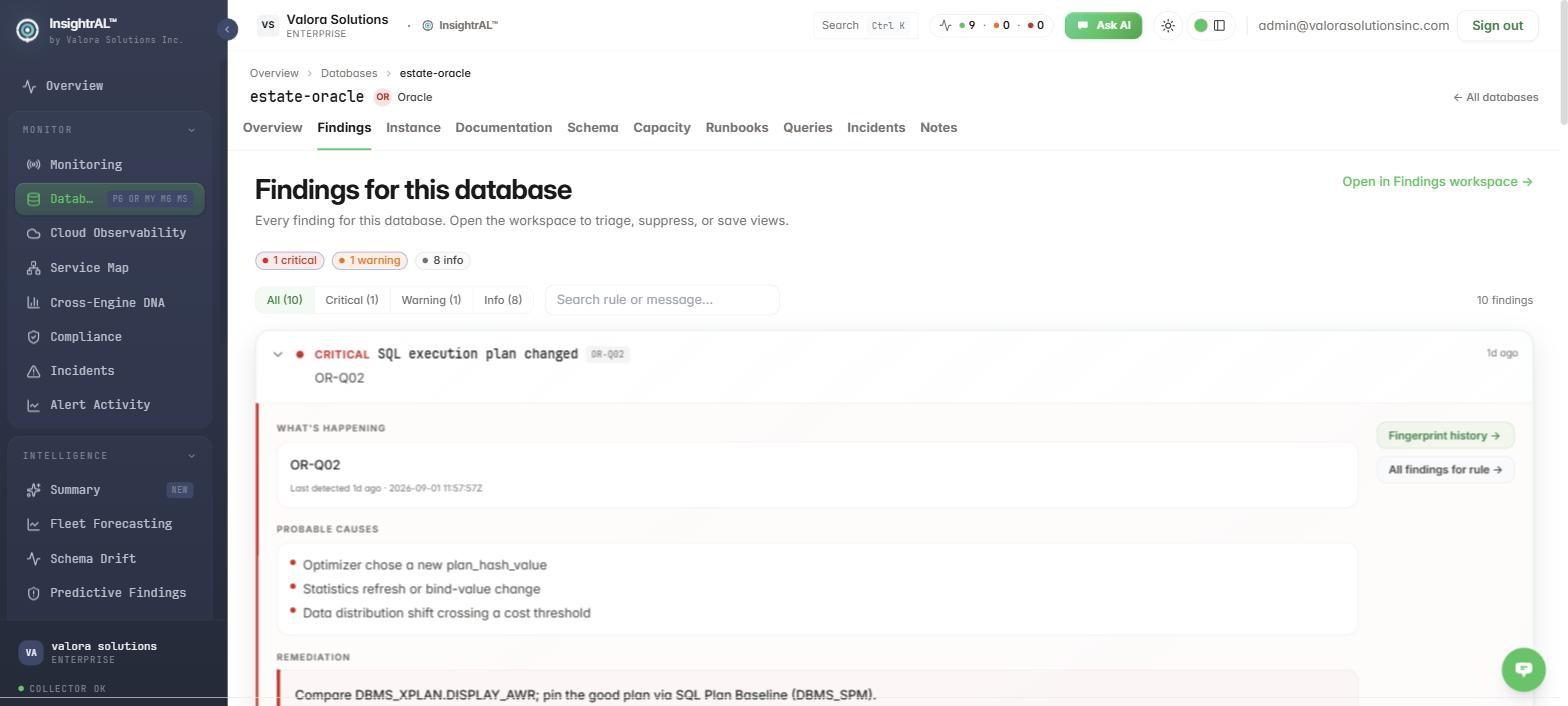
Change and structure
See the shape of the database — and what moved.
A structural map of tables and their relationships, plus a change feed that catches new columns, dropped indexes, type changes, and extension or setting drift. A risky migration never lands silently.
- Relationship map you can actually navigate
- Drift checked every poll, full structural diff nightly
- One timeline per database, not a diff buried in a log
Before it breaks
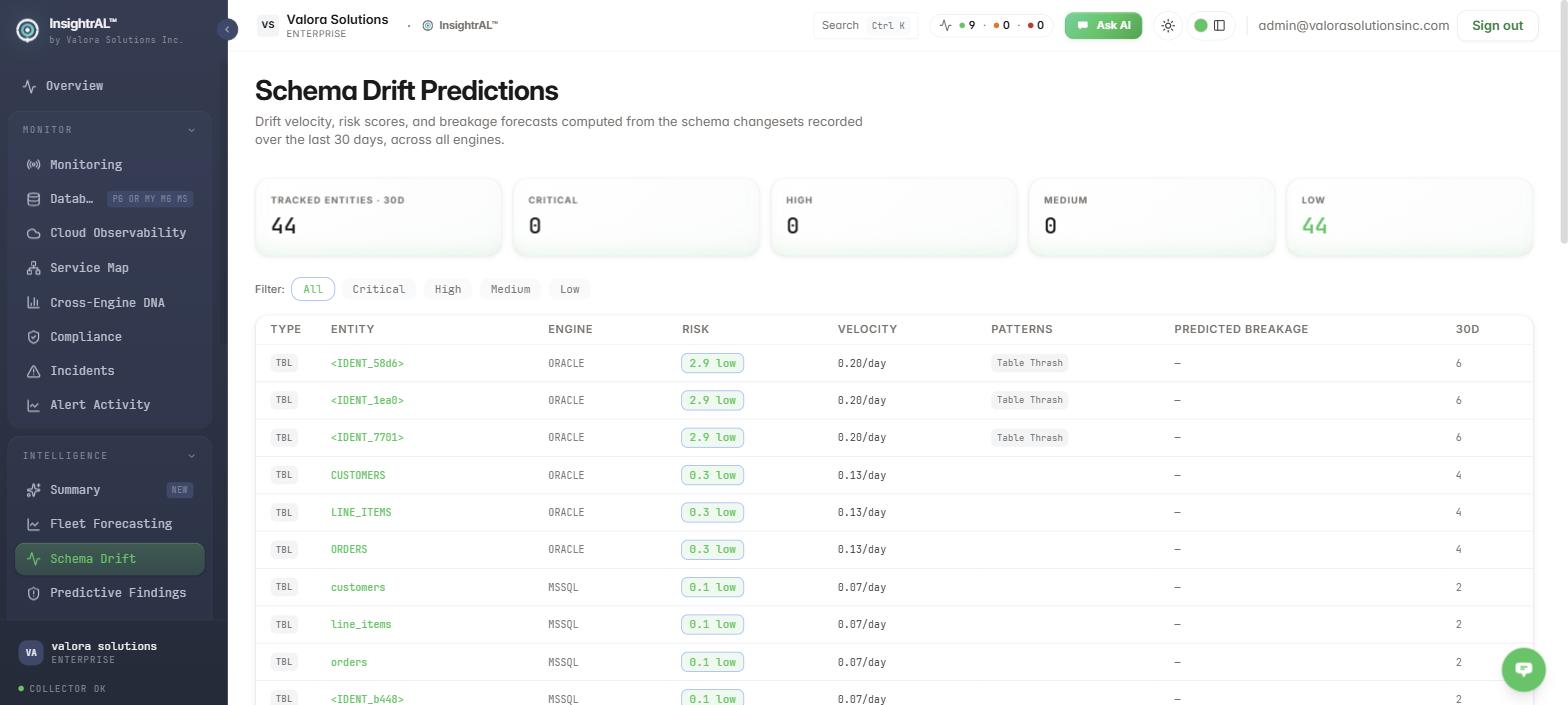
Drift you can see coming, on identifiers we never store.
Every tracked table carries a drift velocity and a risk score computed from the changesets of the last 30 days, per engine. Note the entity names: identifiers are redacted before anything leaves your network, so the forecast works without us ever holding your schema.
- Risk and velocity per entity, ranked across every engine
- Breakage forecast days ahead of the incident, not in the postmortem
- Redacted identifiers — the evidence proves the privacy claim
How it works
Connected in three steps. No credentials handed over.
No connection string leaves your network. No inbound ports. The agent dials out over HTTPS and cryptographically signs every request.
- 1
Add your database
Enter the engine and a label — no credentials. insightral's cloud stores only display metadata and mints a one-time enrollment key.
- 2
Run the agent
One command on any machine that can reach your database — Docker, Linux, Windows, macOS, or Kubernetes. It enrolls, then holds your DSN locally.
- 3
Findings appear
Within ~30 seconds the agent streams signed, redacted findings and metrics. Charts fill, advice appears, and your AI tools can start asking questions.
# one command, anywhere that can reach your DB$ docker run -d --name insightral-agent \ -e INSIGHTRAL_HUB_URL=https://insightral.com \ -e INSIGHTRAL_ENROLL_TOKEN=vgl_enroll_xxxxxxxx \ insightral/agent:latest→ enrolled: production/primary (read-only session)→ reading stats · first findings flowing→ egress: signed findings + metrics onlyThe product
Everything an advisor should do. Nothing a dashboard wall does.
Detect what's wrong, explain it in plain language, route it to the right owner, and give your AI tools a real way to help — across every database you run.
Catch the problem — with the evidence
insightral continuously inspects each database for the issues that actually cause incidents: bloat, blocking chains, runaway queries, plan regressions, schema drift, capacity creep. Every finding comes with the evidence behind it — a fact to act on, not a vague alert.
Browse the checks →Plain-English explanations
Click Explain on any finding and your chosen AI model reads the issue, its evidence, and the database context — then tells you why it matters and the fix to review before you run it. Clear enough to paste straight into a ticket or a postmortem.
How explanations work →Bring your own AI model
Route AI through AWS Bedrock, Anthropic, OpenAI / Azure, or local Ollama for air-gapped deployments. Per-tenant override on Enterprise, keys encrypted at rest. No model lock-in, ever.
Supported providers →MCP-native: your AI calls insightral
Findings, fleet inventory, incidents, query work-items, delivery telemetry, rule docs, and EXPLAIN analysis are all MCP tools. When an engineer asks Claude or Cursor “why is my database slow?”, the agent pulls real advisor findings and can even claim the work — not raw query access.
See the MCP surface →Schema change feed
Extension and setting drift checked every poll, full structural diffs nightly. New columns, dropped indexes, type changes — one timeline, so a risky migration never lands silently.
Change tracking in depth →Privacy-first agent · self-host
The agent holds your connection string locally and streams only signed, redacted findings. Or self-host the entire platform (BYOC) and keep every byte inside your VPC.
Read the security model →Depth, not noise
Checks that explain themselves.
From everyday health to the subtle issues that cause real outages, every finding shows the evidence behind it — so it reads as a fact you can act on, not one more alert to triage.
Everyday health
Missing indexes, sequential scans, bloat, idle-in-transaction, connection pressure, vacuum backlog, replication lag, slow statements, unused & duplicate indexes.
The subtle stuff
Blocking chains, transaction-ID wraparound risk, WAL-retaining slots, extension & configuration drift, plan regressions, and the ghost queries no dashboard surfaces.
Before it breaks
Forecasts that flag bloat and disk headroom heading for trouble — days ahead of the incident, not in the postmortem.
Across your engines
Postgres, Oracle, MySQL, SQL Server, and MongoDB as co-depth flagships — each with rules written for the failure modes that engine is prone to. MongoDB's rules are read-only and runbook-driven: no SQL Lab, no execution-plan capture, remediation hands back a command rather than running it.
MCP-native
When your engineer asks Claude, Claude asks insightral.
Findings, fleet inventory, rule documentation, grounded analysis, EXPLAIN interpretation — all MCP tools your copilots can call, with read-only guarantees. Not a raw SQL pipe. One-command install for Claude Desktop and Cursor.
- Findings, fleet inventory, incidents, query work-items, delivery telemetry — read-only by default
- Take action too: claim a query work-item via an explicit, opt-in write scope
- Built as the safe successor to the archived official Postgres MCP
→ list_findings(database: "production")
insightral has an active HIGH finding: a blocking lock chain on orders (PG-R16), 94 seconds old, 3 sessions waiting. The blocker is an idle-in-transaction session from the reporting job. Want the remediation SQL?
→ get_analysis(rule: "PG-R16")
Same fingerprint fired 3 times this week, always during the 09:00 report…
Example MCP conversation
New in insightral
The latest standout features.
Shipped recently, already in the product — not a roadmap promise.
Security model
The architecture is the security pitch.
insightral never connects to your database and never holds your credentials. Insights leave; data doesn't.
Outbound HTTPS only
No inbound ports, no VPN. The agent dials out and works through corporate proxies unchanged.
Every request signed
HMAC over method, path, timestamp, nonce, and body hash — tamper-proof and replay-proof.
Read-only by design
The agent forces read-only at the session level. It cannot write to your database.
Credentials never leave
Your DSN stays on your machine. insightral's cloud stores only display metadata.
Redaction before egress
Identifiers and local labels are stripped from every payload before it leaves your network.
Tenant isolation (RLS)
Postgres row-level security on every tenant table; the app role cannot bypass it.
Deployment topologies, agent trust chain, and the full posture: Security & Trust → · Need a questionnaire or DPA? Talk to us →
Deployment
One agent. One model. Three ways to run it.
Hosted SaaS
Sign up, run the agent, done. We run the dashboard and AI routing; your raw data never leaves your network — only redacted findings and metrics reach your private insightral tenant.
Self-host (BYOC)
Run the entire platform in your own cloud under license. Docker Compose install; every paid feature works self-hosted.
Enterprise on-prem
Air-gapped with local Ollama, BYOK AI, SSO, audit retention, and multi-engine adapters. Backed by a support SLA.
Where insightral fits
Between “just slow queries” and a platform contract.
RDS Performance Insights
Cloud-native monitors
Tell you which queries are slow. Not why, not what to do, not how confident the fix is.
The advisor in between
InsightrAL™
Deterministic rule depth, AI explanations on your model, an MCP surface for your agents, self-hostable, vendor-neutral. Licensed per database — never per seat.
pganalyze · Datadog DBM
Heavy APM suites
Deep, but hosted-only with hardwired AI — or bundled into a platform contract you didn't set out to buy.
And insightral is independent — vendor-neutral, self-hostable, bring-your-own-AI, while nearly every neutral database-intelligence tool has been absorbed by a cloud or APM vendor.
Stop finding out from your users.
Add a database, run the lightweight agent, and watch insightral surface what’s wrong — with the fix and the owner attached. Your data never leaves your network. Prefer a guided look first? We’re happy to walk you through it.