Intentionally broken for you — 14 findings across 2 critical and 8 high severity issues, spanning Postgres, Oracle, MySQL and SQL Server — four of our five engines (MongoDB is not yet in this seeded estate).
A snapshot from our seeded demo estate with real pathologies. Run insightral on your own databases to get findings like these in under 60 seconds.
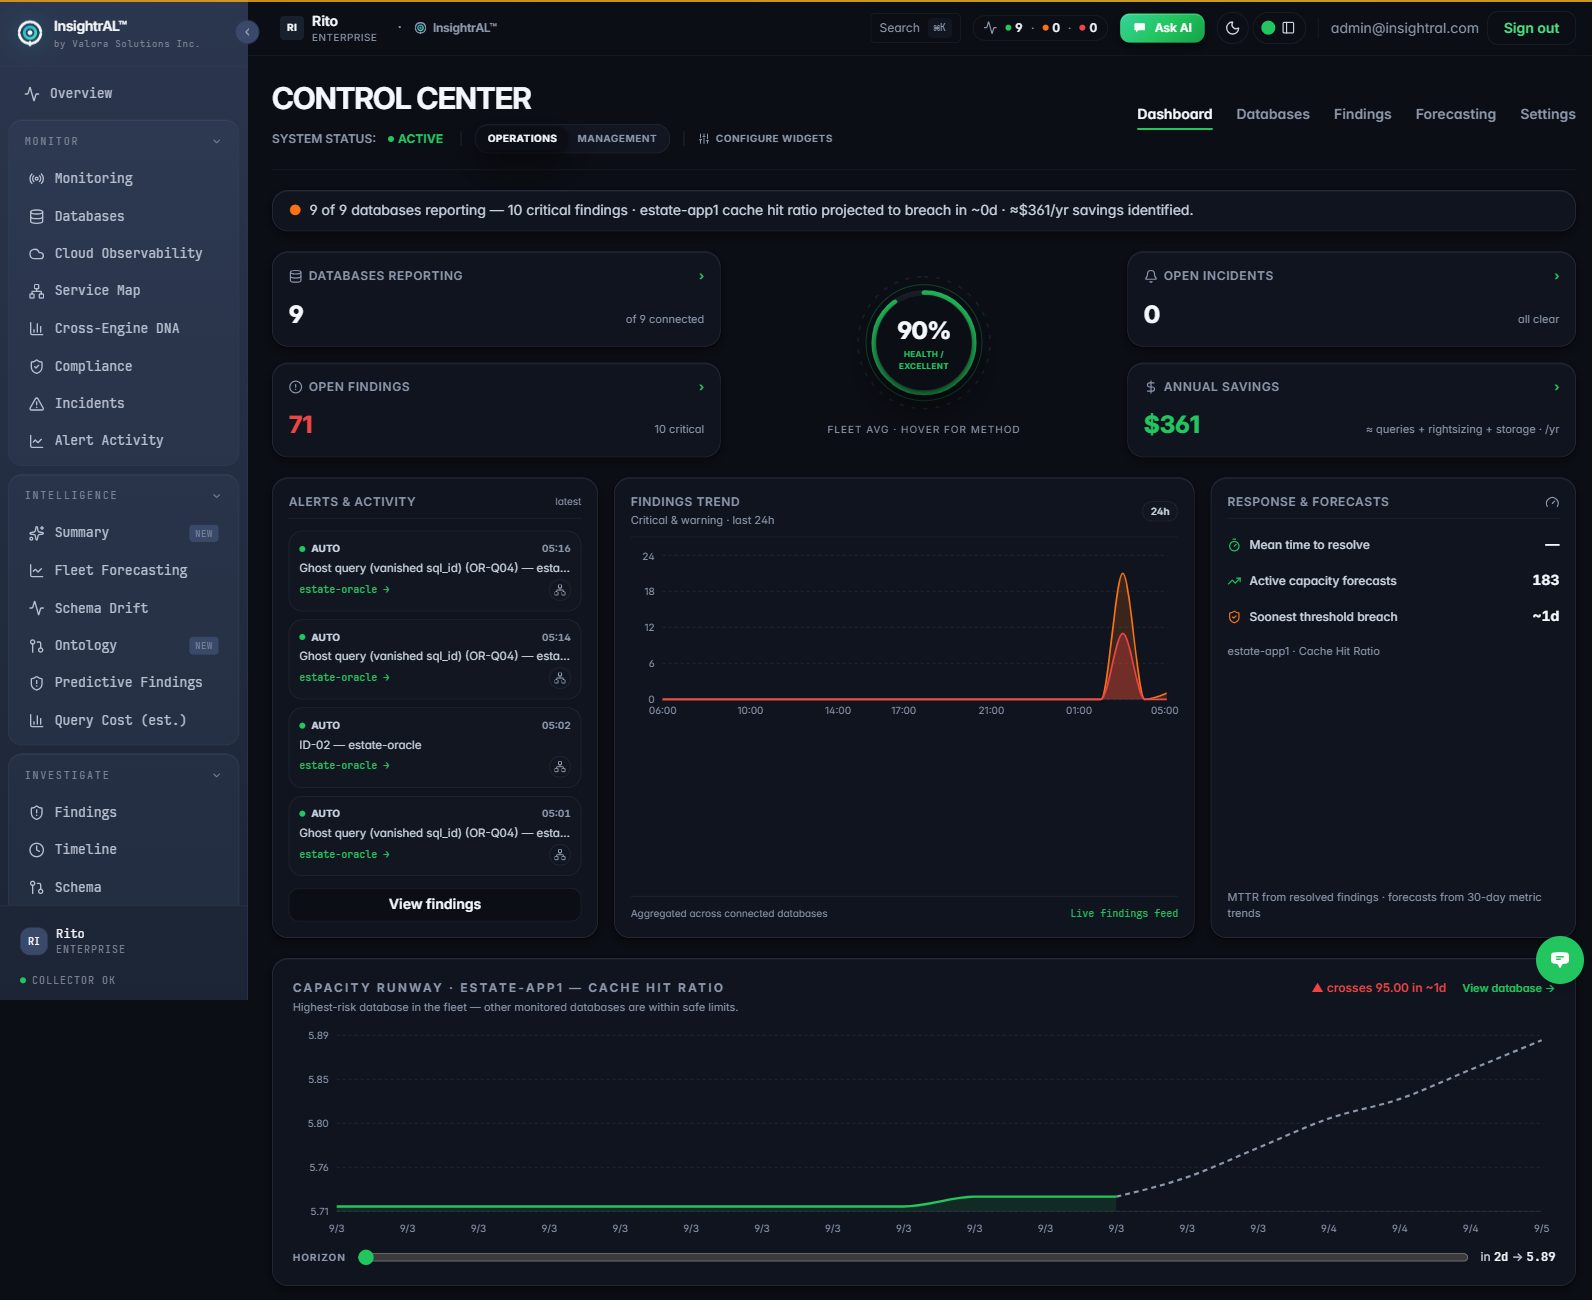
The Control Center — fleet health, open findings and capacity runway across every engine.
insightral
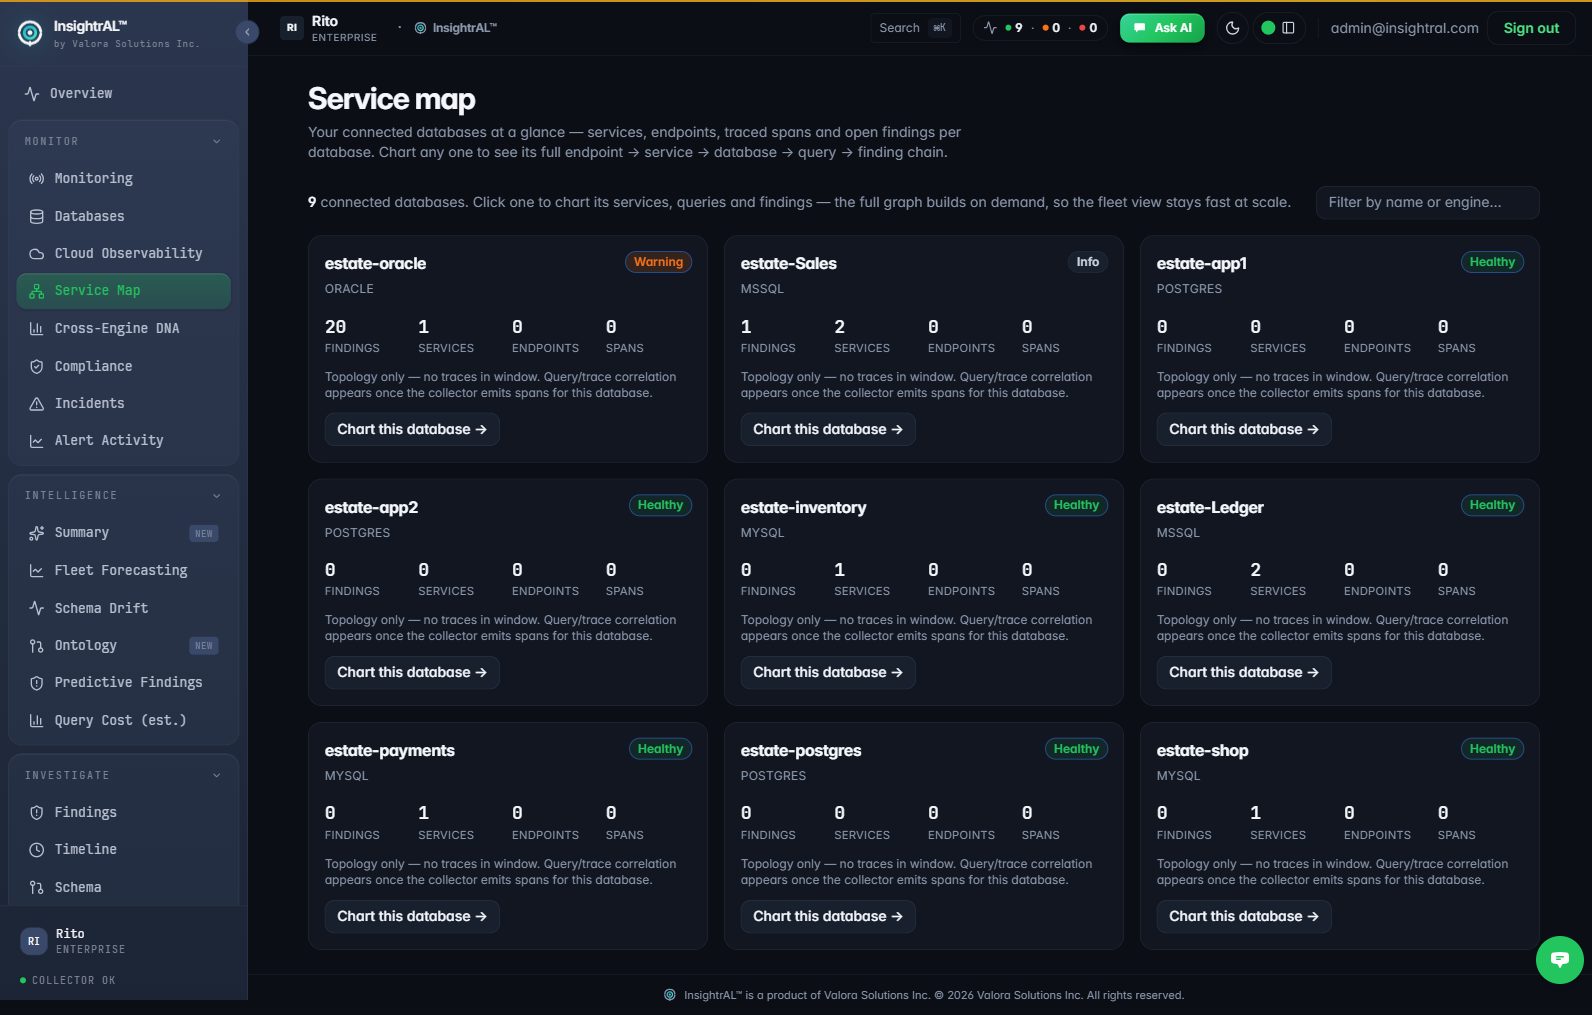
The Service Map — the demo estate: nine databases across four of our five engines.
insightral
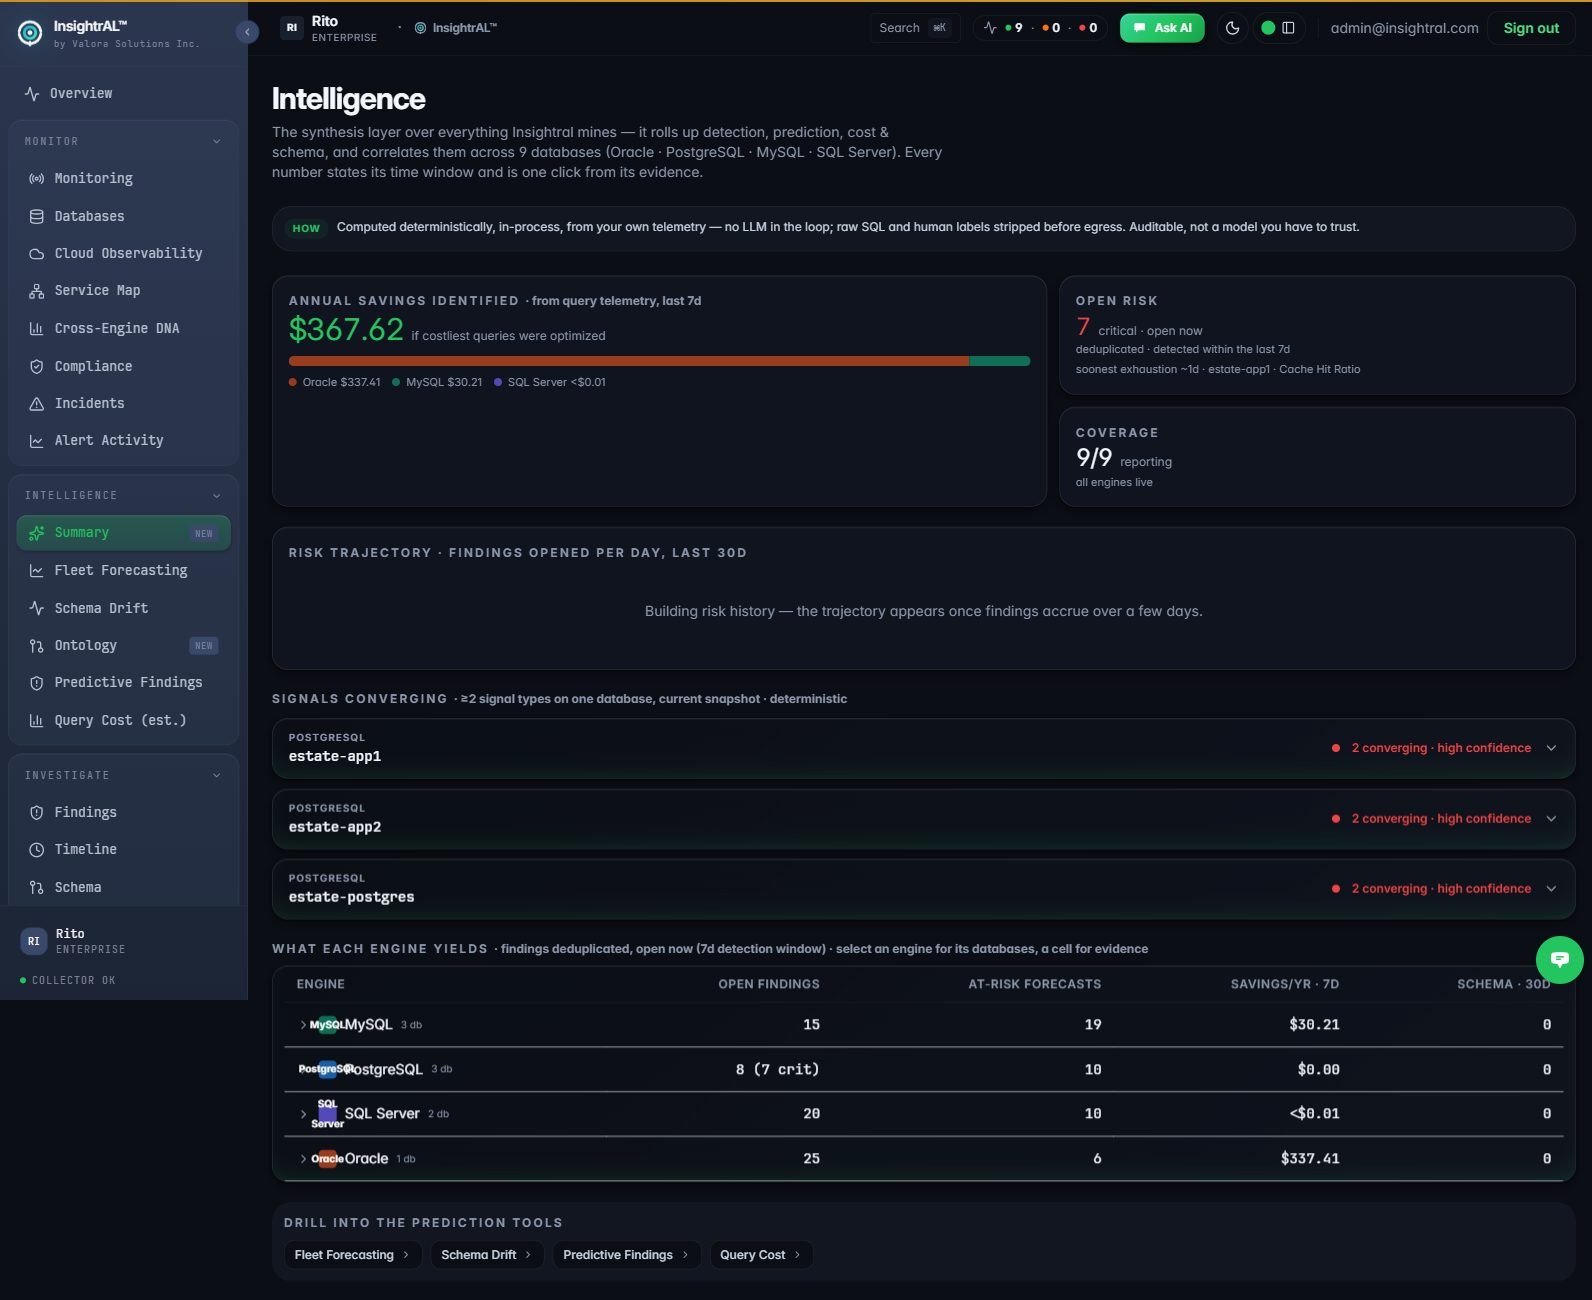
Intelligence — savings identified, open risk, and what each engine yields.
PG-R01criticalPostgreSQL
Missing index on foreign key: orders.customer_id
insightral_demo.orders
Table orders (1,000,000 rows) has a foreign key on customer_id referencing customers(id) but no supporting index. Every JOIN, ON DELETE CASCADE, or lookup by customer_id performs a full sequential scan of the orders table.
Recommendation
Create a B-tree index on orders(customer_id). This converts O(n) lookups to O(log n) and eliminates sequential scans on the join path.
Sequential scan on large table: products (500,000 rows)
insightral_demo.products
Table products is 500,000 rows. Queries filtering on the name column (e.g., product search) perform full sequential scans because no index exists on that column. pg_stat_user_tables shows seq_scan count growing every minute.
Recommendation
Add an index on products(name). For prefix searches, a standard B-tree index suffices. For full-text search, consider a GIN index with to_tsvector.
Connection pid=18432 (user: app_user, application: rails-worker) has held an open transaction for 47 minutes 12 seconds. Long transactions prevent VACUUM from reclaiming dead tuples, cause table bloat, and can starve other sessions waiting on row-level locks.
Recommendation
Investigate the application code responsible for this connection. Add statement_timeout and idle_in_transaction_session_timeout to the connection pool configuration to bound transaction lifetime.
Table bloated_events has 300,000 live rows but 201,000 dead tuples (67% bloat ratio). autovacuum is disabled via storage parameters. The table consumes 3x more disk than necessary and every sequential scan reads the dead rows.
Recommendation
Run VACUUM ANALYZE on the table immediately, then re-enable autovacuum with reasonable thresholds. The current autovacuum_enabled=false setting is almost never correct in production.
Connection pid=20011 (user: reporting_ro, application: metabase) has been idle-in-transaction for 23 minutes 4 seconds. The transaction holds shared locks that block VACUUM on affected tables and may starve DDL operations.
Recommendation
Set idle_in_transaction_session_timeout at the role or database level. Most BI tools do not require long open transactions — this is typically a missing COMMIT in the query tool.
Autovacuum backlog: audit_log not vacuumed in 6 days
insightral_demo.audit_log
Table audit_log (500,000 rows) has autovacuum_vacuum_scale_factor = 1.0 and autovacuum_vacuum_cost_delay = 100. Autovacuum will not trigger until 500,000 rows are dead — effectively never. Last autovacuum: 6 days ago. Dead tuple count: 100,000.
Recommendation
Reset autovacuum storage parameters to defaults (scale_factor 0.02, cost_delay 2ms). Run a manual VACUUM ANALYZE to clear the backlog.
Unused index: events_log_source_idx (0 scans since stats reset)
insightral_demo.event_log.events_log_source_idx
Index events_log_source_idx on event_log(source) has recorded 0 index scans since statistics were last reset. It consumes approximately 4 MB and adds write overhead to every INSERT on event_log (100,000 rows). The query it was built for appears to have been removed.
Recommendation
Drop the index after confirming no query uses it. Use pg_stat_user_indexes to verify the scan count has remained 0 for at least one full week before dropping.
Duplicate index: products_sku_idx2 is identical to products_sku_idx
insightral_demo.products.products_sku_idx2
Two indexes exist on exactly the same column (products.sku) with identical expressions: products_sku_idx and products_sku_idx2. The duplicate consumes an extra 18 MB and doubles write overhead on every INSERT/UPDATE to products.
Recommendation
Drop one of the two indexes. Keep products_sku_idx (the original); drop products_sku_idx2.
Autovacuum starvation: large_metrics (1,000,000 rows, 250,000 dead tuples)
insightral_demo.large_metrics
Table large_metrics has autovacuum_vacuum_scale_factor = 1.0. Autovacuum will not trigger until 1,000,000 rows are dead — a threshold that can never be reached naturally. 250,000 dead tuples have accumulated, inflating table size by ~25% and degrading every sequential scan.
Recommendation
Reset scale_factor to 0.05 (trigger vacuum when 5% of rows are dead) and run a one-time VACUUM ANALYZE to clear the backlog immediately.
Sort spill risk: order_items has no index on amount (2,000,000 rows)
insightral_demo.order_items
Queries on order_items that ORDER BY amount (e.g., revenue reports, refund processing) cannot use an index and must sort 2,000,000 rows in memory or spill to temporary files. pg_stat_database shows temp_bytes growing by ~500 MB/hour during business hours.
Recommendation
Add an index on order_items(amount) if ORDER BY amount is a frequent query pattern. For range scans, consider a composite index on (order_id, amount).
The library cache hit ratio has fallen below threshold. A high proportion of statements are being hard-parsed, indicating literal SQL without bind variables. Hard parsing consumes shared pool memory and serializes on the library cache latch, degrading every session.
Recommendation
Identify the top literal-SQL statements and convert them to use bind variables, or set CURSOR_SHARING=FORCE as a stopgap while the application is fixed.
Checkpoints are being forced by redo log switches occurring faster than the recommended interval. Undersized redo logs cause frequent log switches, incremental checkpoint storms, and 'checkpoint not complete' waits that stall all DML.
Recommendation
Resize the online redo logs so that switches occur roughly every 15-20 minutes at peak load; add log groups if switch frequency remains high.
The InnoDB buffer pool hit ratio has dropped below threshold - the working set no longer fits in memory and reads are spilling to disk. Query latency rises sharply once the hot data set exceeds the buffer pool.
Recommendation
Increase innodb_buffer_pool_size toward 70-80% of available memory on a dedicated host, and review large table scans that churn the pool.
The transaction log for this database is above the space threshold and autogrowth events are occurring during peak hours. Log growth during load causes write stalls, and an unmanaged log can fill the volume and halt all writes.
Recommendation
Check log_reuse_wait_desc for what is pinning the log (unreplicated transactions, long-running transaction, missed log backups), then restore a regular log backup cadence and pre-size the log to its working size.