Capability map
Every feature, written down.
insightral is a database advisor, not a graph wall. Deterministic detection, explanation on the AI model you choose, a first-class MCP surface for your agents, and a privacy-first architecture that keeps your data on your side of the wall.
01 · Rules engine
129 deterministic checks across five engines, in pure Go, with evidence.
Every rule is explicit code that runs in-process in under 10ms — no LLM call in the detection path. A finding carries its rule id, severity, fingerprint, structured evidence, first/last seen, and occurrence count. Findings are facts; AI only explains them.
Core health
R01–R15- PG-R01Foreign keys without a supporting index
- PG-R02Sequential scans on tables above row-count threshold
- PG-R03Long-running transactions past configurable threshold
- …and 12 more — book a demo for the full catalog.
Depth
R16–R26- PG-R16Blocking lock chains detected
- PG-R17Blocking chain age exceeds 60 seconds
- PG-R18TXID horizon approaching wraparound (>1.5B)
- …and 9 more — book a demo for the full catalog.
Predictive · latency · posture
P / Q / SEC- PG-P01Table bloat growth projected to reach excessive levels within weeks
- PG-P02Disk utilisation growth projected to reach critical levels within weeks
- PG-Q01Query P95 latency (24h) exceeds 2× the trailing-7-day median
- …and 1 more — book a demo for the full catalog.
Every engine, same depth
OR / MY / MS- OR-O06Oracle — low library cache hit ratio (hard-parse pressure)
- OR-O08Oracle — redo log checkpoint pressure
- MY-Q02MySQL — low InnoDB buffer pool hit ratio
- …and 3 more — book a demo for the full catalog.
Why deterministic
Monitoring you can audit. Each rule documents its detection SQL, fix SQL, worked example, and false-positive guidance — in the open catalog.
Open the rule catalog →02 · AI explanations
Plain English, grounded in the evidence.
Click Explain on any finding. The model receives the rule definition, the structured evidence, and the monitoring context for that database — then explains why it matters, what to run, and what the trade-offs are.
- Grounded: the model reads rule + evidence + context, never your raw data
- Metered: per-tier AI budgets so costs are never a surprise; detection continues even when AI pauses
- Honest: deterministic findings stay identical whether or not you use AI at all
AI explanation · PG-R04 dead-tuple bloat
events is 38% dead tuples (12.4 GB). Autovacuum is configured but losing the race against your update rate — the table churns ~2M rows/day while the global cost limit throttles vacuum.
ALTER TABLE events SET (
autovacuum_vacuum_scale_factor = 0.02,
autovacuum_vacuum_cost_limit = 2000
);
Trade-off: more vacuum I/O on this table. Safe to apply; takes effect on the next autovacuum cycle.
Example explanation — generated on your own model
Bring your own model — Anthropic, OpenAI, Azure, Bedrock, or fully local Ollama.
03 · Bring your own AI
Your model. Your key. Your data boundary.
Enterprise and self-hosted deployments bring their own key — per-tenant, encrypted at rest. Swap providers without touching a single finding.
- No vendor lock: change AI providers in settings, not in a migration
- BYOK on Enterprise — your usage, your bill, never gated by us
- Air-gapped option: local Ollama, zero external AI calls
04 · MCP surface
A first-class MCP surface for your AI agents.
Findings, fleet inventory, rule documentation, grounded analysis, and EXPLAIN-plan interpretation — reachable from Claude Desktop, Cursor, Copilot, or any MCP client. Every new capability ships with a matching tool as a design rule. Your AI assistant answers “why is my database slow?” with real advisor intelligence instead of guessing from a raw SQL pipe.
- Read-only by default with a documented MCP security posture
- Advisor output: evidence + remediation, not just query execution
- Built as the safe successor to the official Postgres MCP, archived after a SQL-injection CVE
// tools/list — what your AI agent seeslist_findings — active findings w/ severity + evidencelist_connections — fleet inventory across databasesdescribe_rule — full docs for any advisor ruleget_analysis — grounded analysis for a findinganalyze_explain — interpret an EXPLAIN plan→ read-only · redacted · tenant-scoped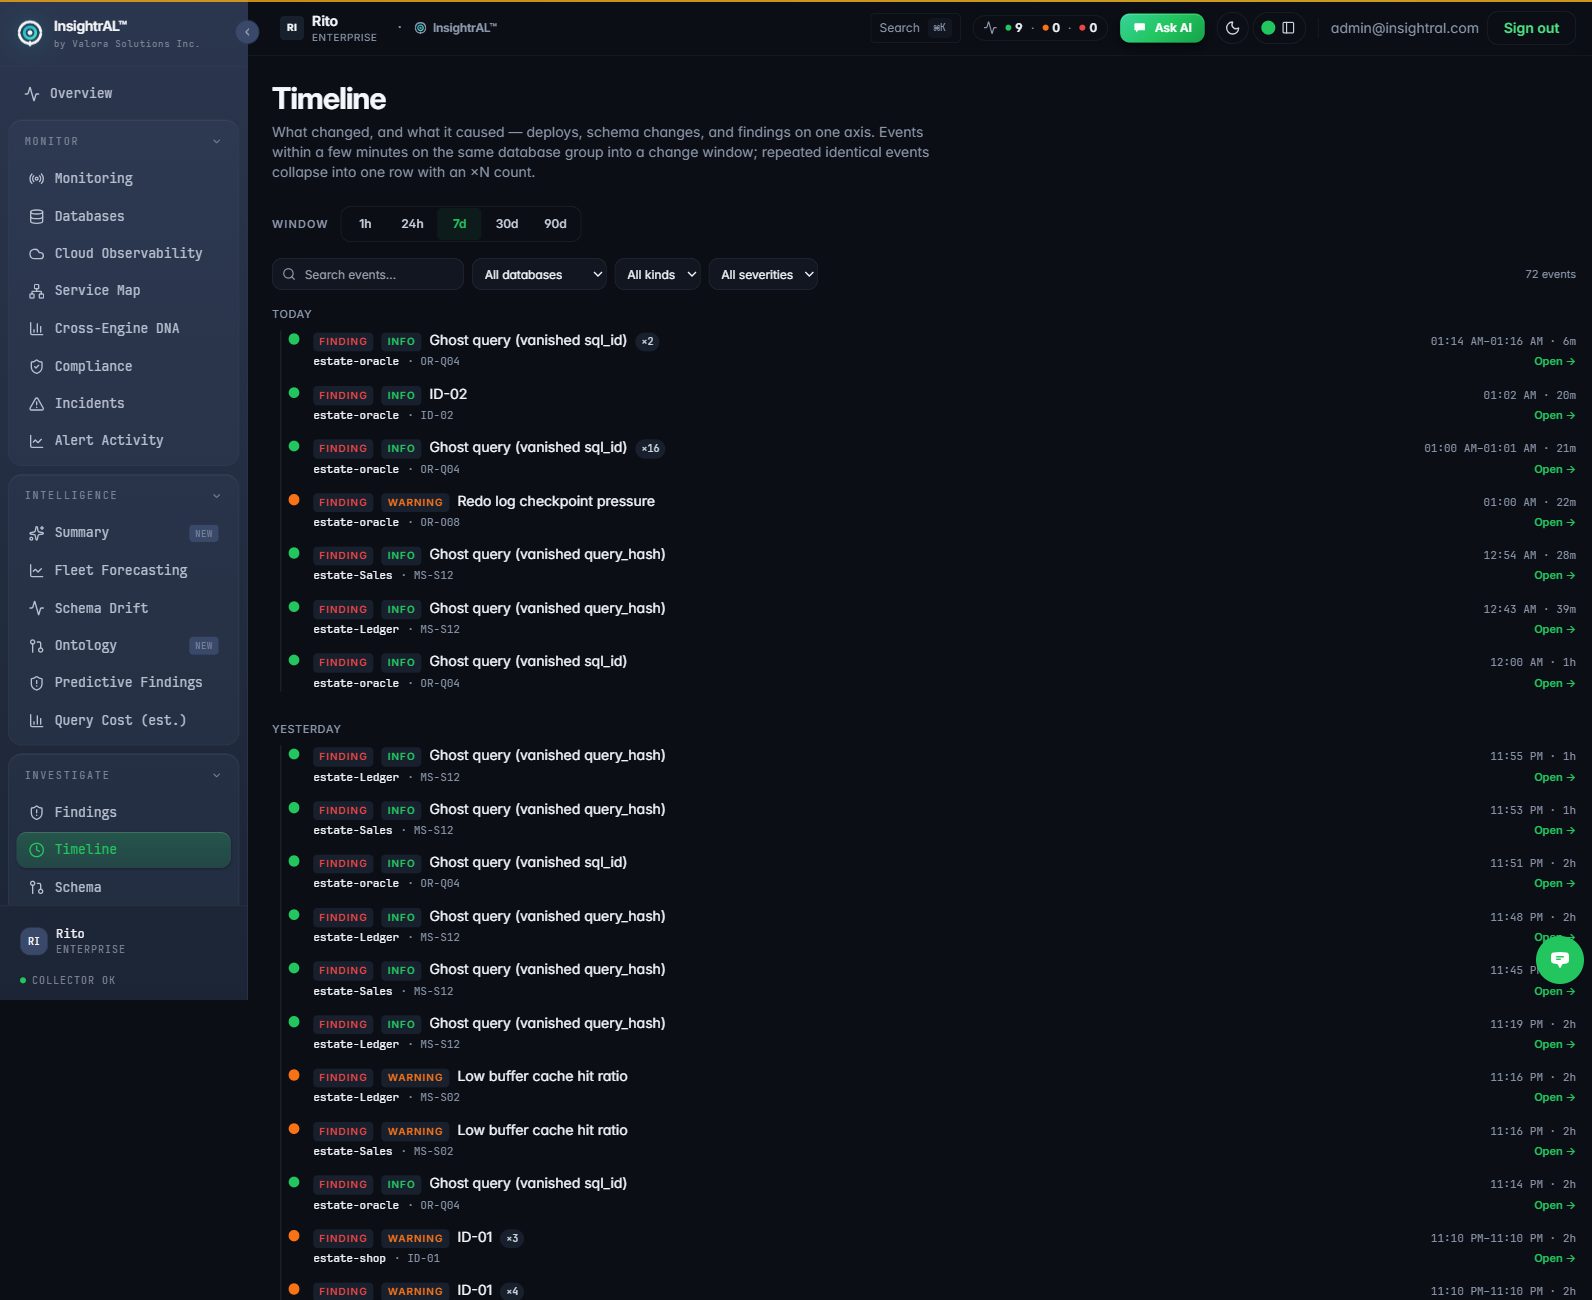
05 · Schema change feed
A risky migration never lands silently.
Extension and setting drift is checked on every poll; full structural snapshots are diffed nightly. New columns, dropped indexes, type changes — one unified timeline, correlated with the findings they cause.
- Catches the index your migration forgot — before it becomes an incident
- Extension and GUC drift detection (PG-R22, PG-R25)
- Plan-hash regression ties a schema change to the query it slowed down
06 · Query console & explorer
Investigate where the findings live.
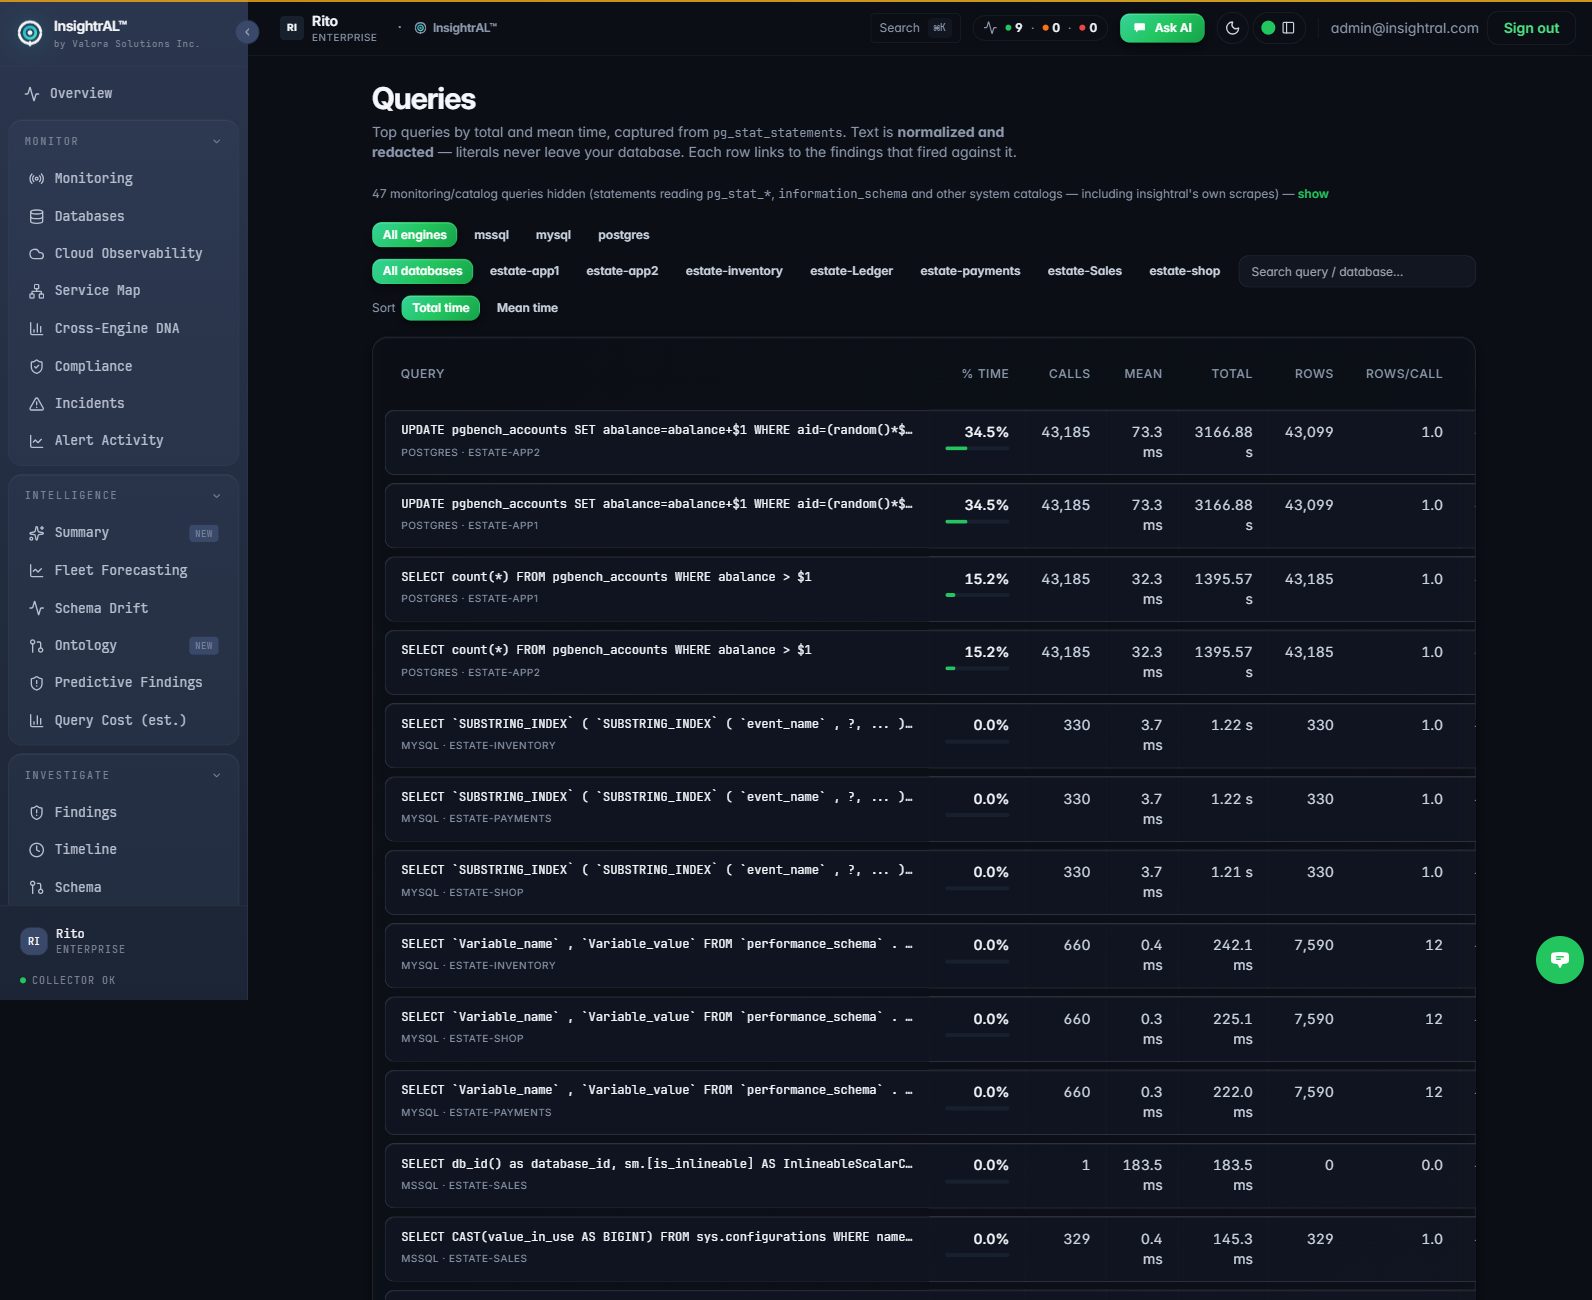
A keyboard-first SQL workbench and a schema explorer, inside the dashboard. Browse tables, sizes, columns and indexes; jump into the console to test a hypothesis; export results as CSV or JSON.
- ⌘/Ctrl+Enter to run, query history with timing and row counts
- Every run is fingerprint-logged to the audit trail — a 160-char snippet and a SHA-256 fingerprint, never the full literal
- Schema explorer: tables, sizes, columns, indexes — one click from a finding to the object it names
07 · Live database cockpit
One database, every angle, honestly scored.
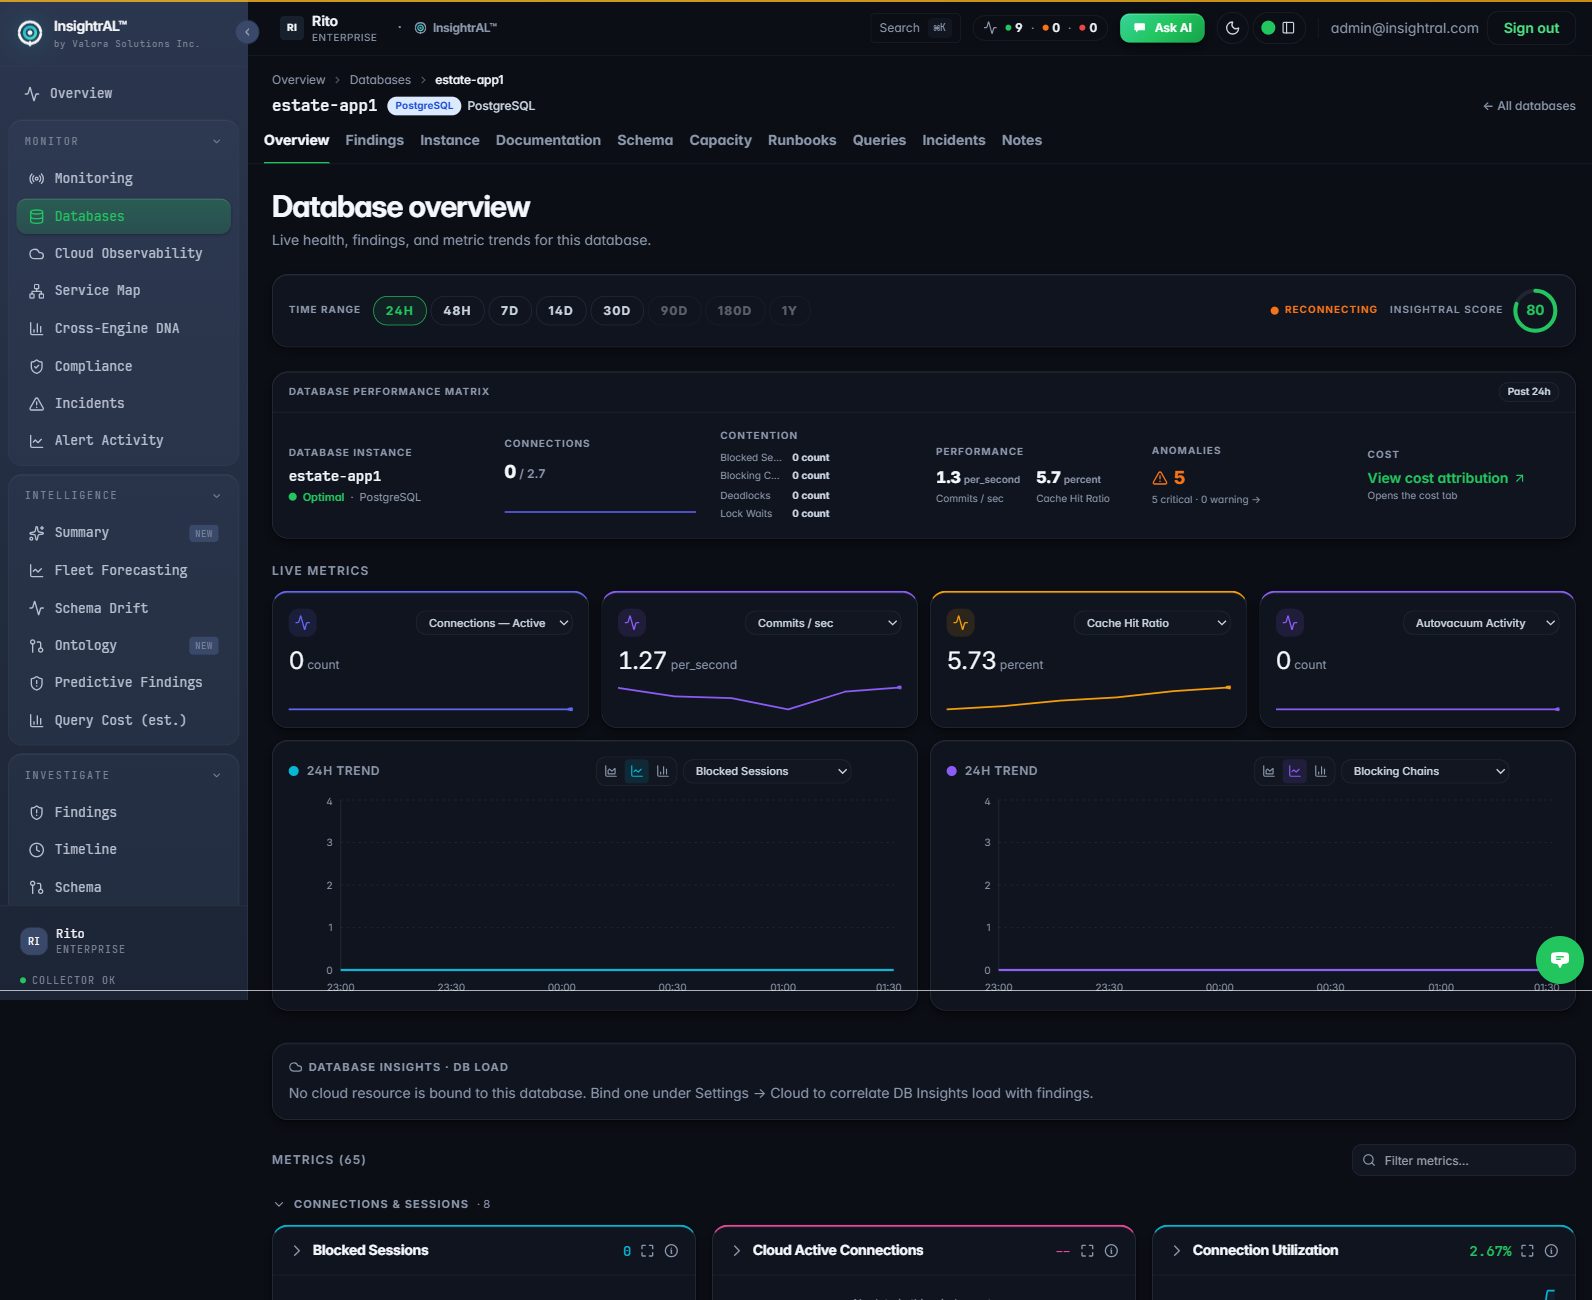
Each database gets a focused detail view: live metric panels for blocking, autovacuum, transaction-id age, replication slots and sequential scans, plus per-DB tabs for findings, queries, schema, changes, capacity and incidents.
- insightral Score health ring — and it shows “—”, not a fake number, until real telemetry arrives
- Live panels stream from the agent on your poll interval (down to 30s)
- Query latency regression and plan-change rules feed the same view
Operate · Alerting & incidents
From a finding to a paged on-call to a closed incident — one thread.
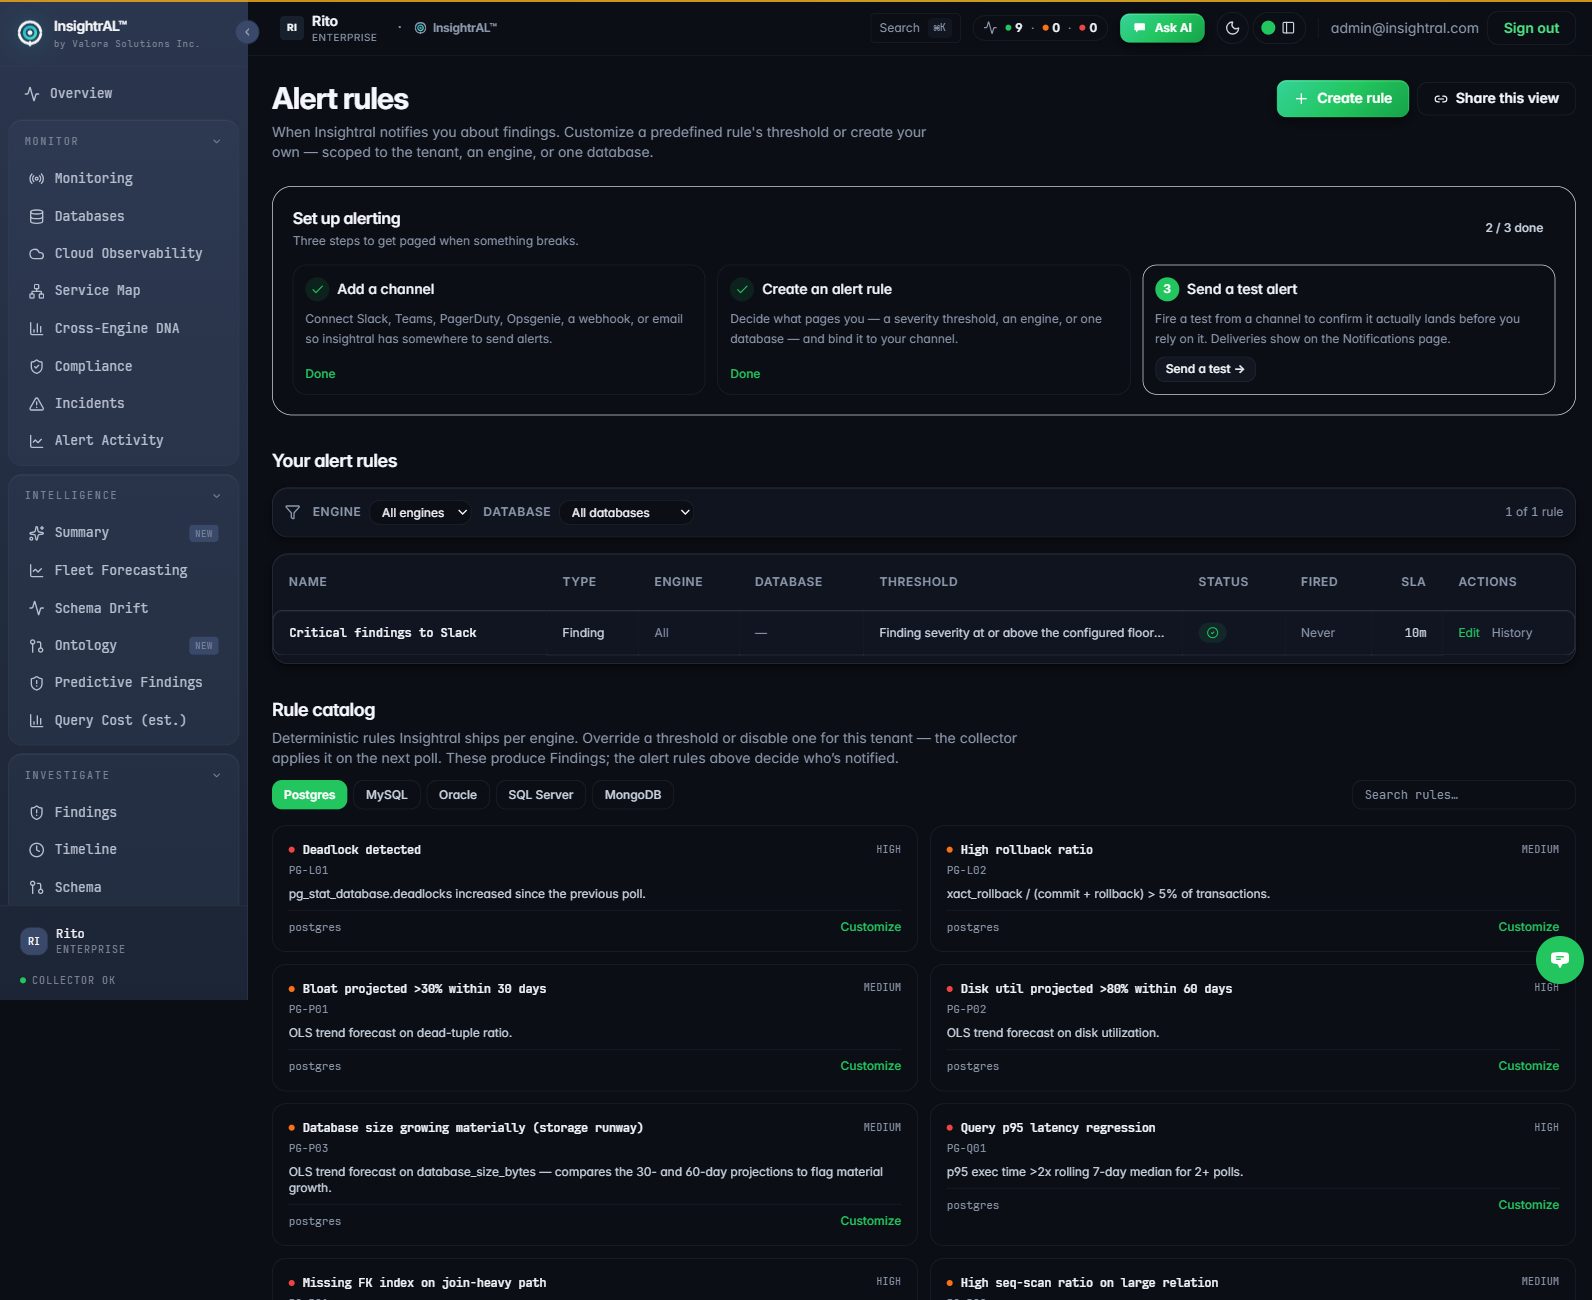
Alert rules decide what pages you and where; a critical finding auto-opens a de-duplicated incident (one per rule + fingerprint) and insightral records the whole action trail. Delivery telemetry proves a notification actually landed — no more guessing whether the page went out.
- Channels: Slack, Microsoft Teams, PagerDuty, Opsgenie, generic webhook, email
- Per-attempt delivery log — channel, status, latency, retry — and a real success rate, not a placeholder
- Incident action trail: opened → notified → acknowledged → resolved, with who did what and what was sent
- Acknowledging an incident cascades to its findings and the query owner — one source of truth
Triage · Query work-items
Claim a noisy query. Own all its findings.
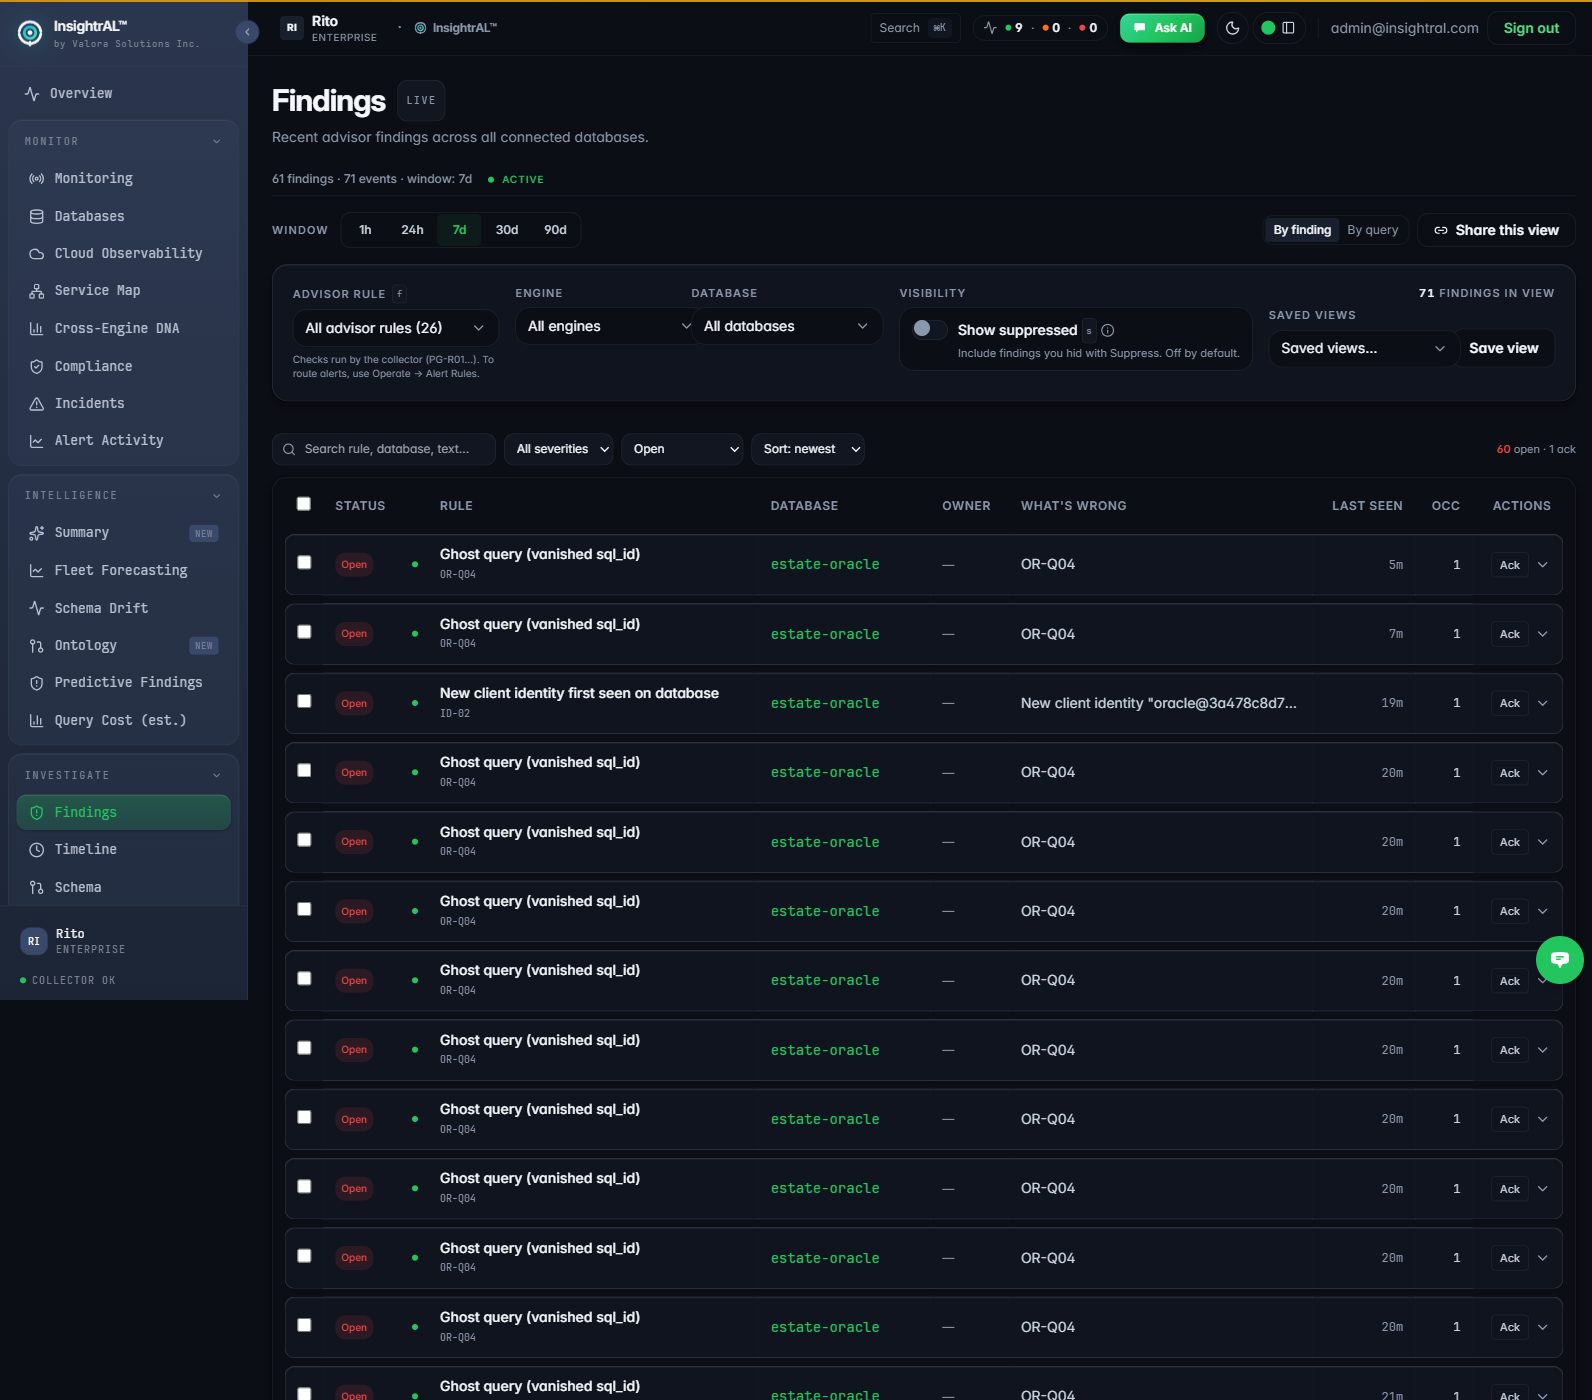
A query that trips ten rules collapses into one work-item per query + database. Accept it once and the whole group is assigned to you and acknowledged — with the owner shown on every view, and a single Jira or Linear ticket that gathers later findings as comments instead of spawning duplicates.
- “By query” mode on Findings: query → N findings, owner, status, ticket
- Claim-the-group: accept one, own them all — no per-finding busywork
- Auto-create one ticket per alert; child findings become comments, never duplicate tickets
- Owner reads the same everywhere: per-finding, by-query, and on the incident
Resolve · Runbooks
Playbooks for Postgres and Oracle. Execution that alerts.
A built-in remediation library for the depth flagships — written like an on-call would: diagnosis queries, mitigation, the durable fix, and escalation. Executable runbooks run through a signed, approval-gated job; approving one notifies your alert channels, so a production fix is never silent.
- Postgres: bloat & txid wraparound, connection saturation, lock contention, WAL/disk growth, index bloat
- Oracle: blocking sessions, ORA-01555, tablespace & temp pressure, hard-parse storms, redo churn
- Approval-gated execution out-of-band — the dashboard never runs SQL itself
- Search + engine filters in the library; the right engine's playbooks surface first from a finding
PostgreSQL
Replication lag · slow query · bloat & wraparound · lock contention · WAL growth · index bloat
Oracle
Blocking sessions · ORA-01555 · tablespace full · temp exhaustion · library cache · redo / log switch
Cross-engine
MySQL deadlocks · Oracle wait-class spikes · SQL Server tempdb pressure
Built-in library
08 · Privacy-first agent
Insights leave. Data doesn't.
The agent is the only thing that touches your database — and it lives on your infrastructure. insightral's cloud never sees a connection string.
DSN stays local
Credentials live on your machine; the cloud stores display metadata only.
One-time enrollment
Single-use enrollment key exchanges for a scoped credential bound to one database.
HMAC-signed telemetry
Every request signed over method, path, timestamp, nonce, and body hash.
Read-only session
default_transaction_read_only is forced; an over-privileged role raises a finding (PG-SEC01).
Redaction pipeline
Identifiers and local labels stripped before any payload leaves your network.
Outbound HTTPS only
No inbound ports; survives firewalls and proxies unchanged.
Durable local buffer
Findings land in a bounded local SQLite ring buffer first — a network blip never loses telemetry.
Revocable per database
Each credential is scoped and individually revocable from the dashboard.
Full deployment topologies and the collector security model: Security & Trust →
09 · Notifications
The right finding, in the right channel.
Findings dispatch to Slack, Microsoft Teams, email, and generic webhooks — so the team that owns the database hears about it first. PagerDuty and Opsgenie routing are next on the roadmap.
- Slack notifications on every tier, including Free
- Microsoft Teams and email channels
- Signed generic webhooks for your own automation
insightral APP
HIGH · PG-R16 blocking lock chain on orders — 3 sessions waiting, 94s.
production/primary · View finding → · Explain →
Example Slack notification
10 · Multi-engine
Five engines. One depth standard.
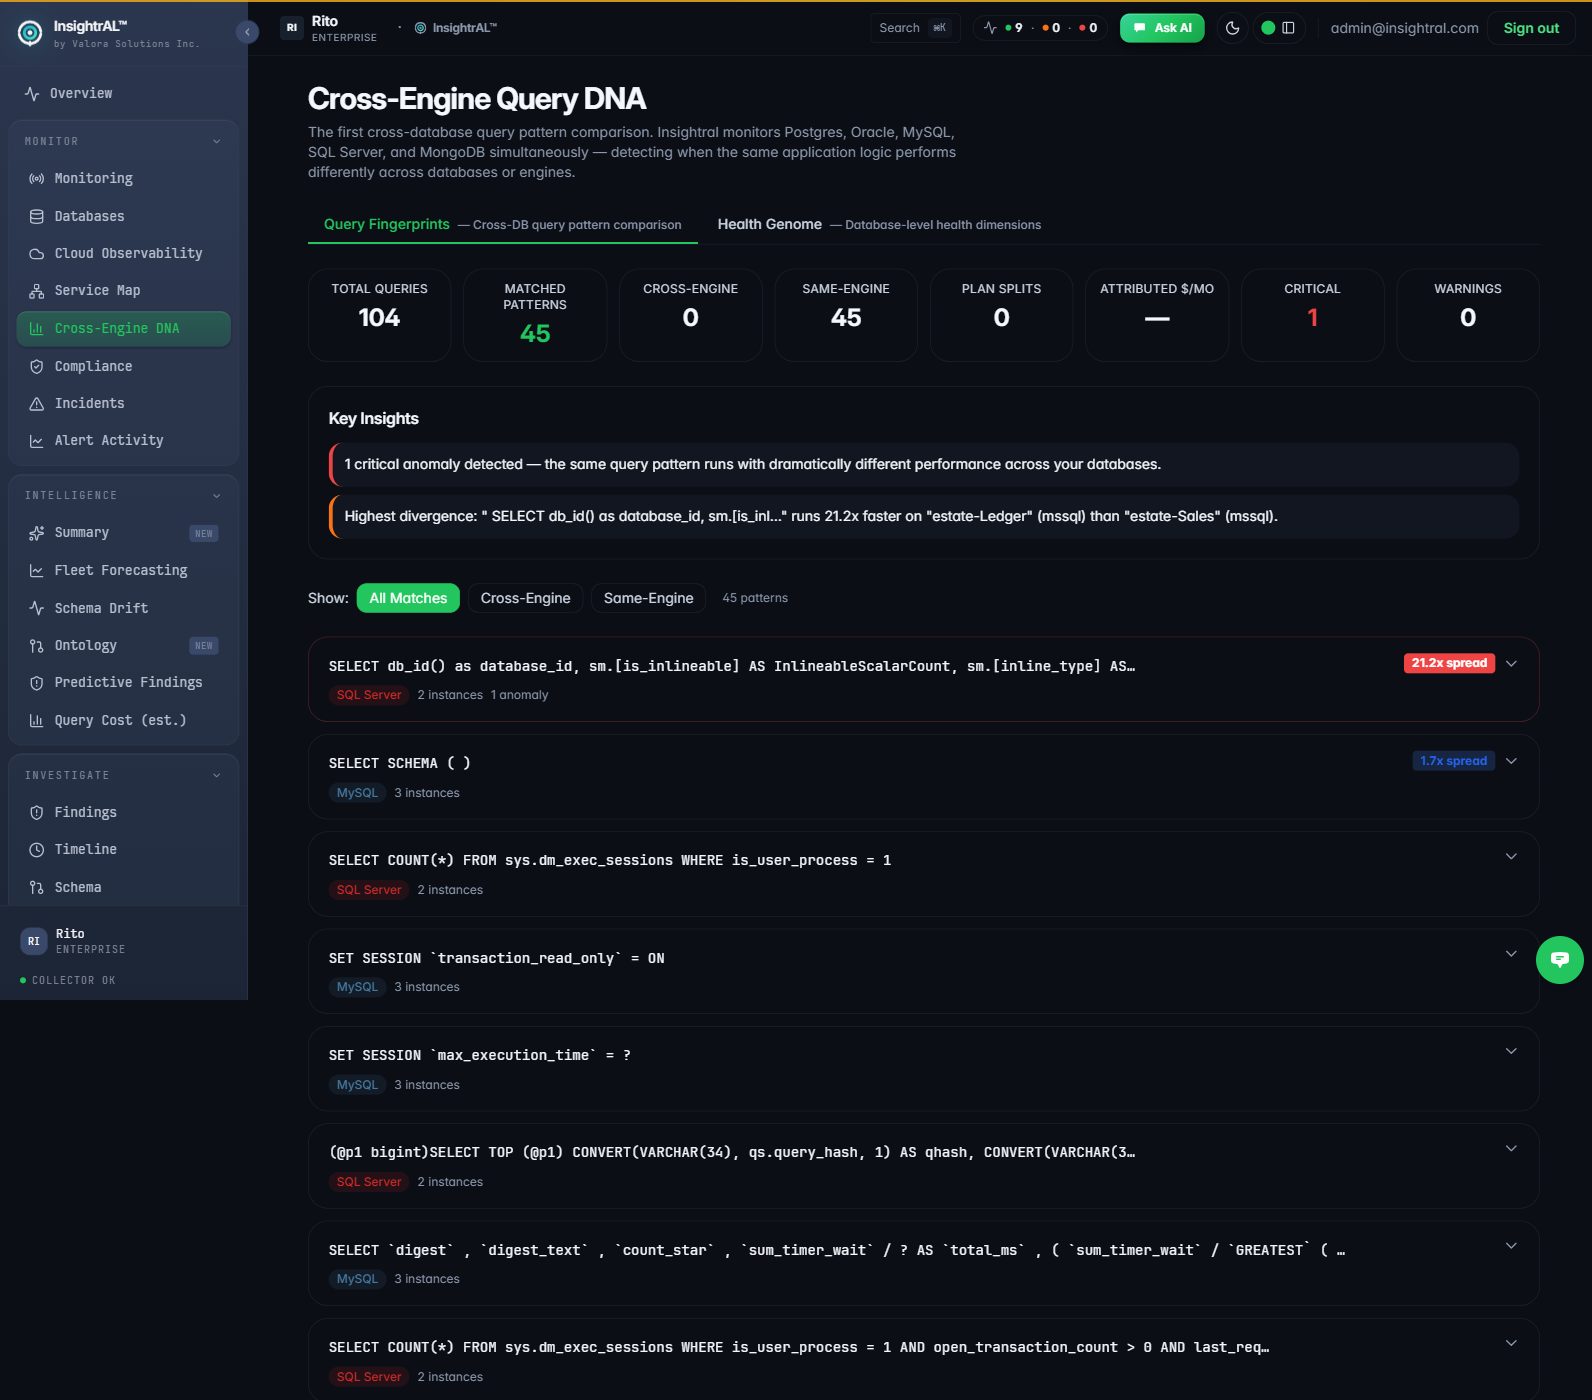
Postgres, Oracle, MySQL, SQL Server, and MongoDB are co-equal flagships: deterministic rules written against each engine's native instrumentation, with the same finding shape, metric sampling, regression detection, and log ingestion across all five. MongoDB's rules run against its own instrumentation ($queryStats/profiler, serverStatus, getLog) rather than a SQL layer. Licensed per engine × databases.
PostgreSQL
34 rules · Query Insights, wait events, execution plans
Oracle
26 rules · wait-class depth, plan capture, alert-log ingestion
SQL Server
26 rules · plan capture, wait stats, error-log ingestion
MySQL
25 rules · statement latency, log ingestion (no plan hash — engine limitation)
MongoDB
18 rules · query capture, metrics/wait-events, schema inference, server-log findings — no SQL Lab, no execution-plan capture, remediation is runbook-only (the agent validates and hands back the command, never executes it)
11 · Deployment
Hosted, self-hosted, or air-gapped.
One agent and one data model across all three shapes. Non-root containers, deterministic builds, digest-pinned deploys.
Hosted SaaS
Sign up and run the agent. We operate the dashboard and AI routing; your raw data never leaves your network — only redacted insights reach your private insightral tenant.
Self-host (BYOC)
The entire platform in your cloud under license — Docker Compose install, every paid feature included.
Enterprise on-prem
Air-gapped with local Ollama, BYOK, SSO, audit retention, multi-engine, and a support SLA.
12 · Availability & correlation
From endpoint to database — one correlated picture.
Opt-in licensed modules extend insightral above the database: endpoint monitoring, public status pages, trace ingest, and a correlation service map that walks endpoint → service → database → query → finding → fix. Riding the same alert-routing spine as your database findings. Contact us to enable them.
Uptime monitoring
HTTP(S) endpoint checks with per-monitor thresholds — consecutive-failure gating before paging, degraded and down latency SLOs — plus monitor groups with worst-of rollups and maintenance windows that suppress paging without rewriting history.
API monitoring
Run checks from insightral's hosted multi-region probe fleet — zero infrastructure on your side — or from a customer-run node agent for private endpoints. Full lifecycle from the dashboard: create, tune, pause, group, route alerts.
Public status pages
Subscriber-notified status pages fed by your monitors, with double-opt-in email subscriptions. Status history reflects real checks — an outage inside a maintenance window is recorded, just not paged.
Trace ingest
OTLP plus AWS X-Ray, Azure Application Insights, and GCP Cloud Trace. Spans join your monitoring data so a slow endpoint links to the service and database behind it. 30-day retention.
Correlation service map
One directed graph of the estate: services deduplicated across databases, every hop badged trace-backed or correlation-inferred, per-app and per-database scoped views, ranked probable causes — suspect order, not asserted cause.
Shadow-IT & API governance
Deterministic findings flag database clients with no application identity — ungoverned services look exactly like this. The cloud connector inventories your AWS API Gateway and Azure API Management estates and shows which APIs are monitored, unmonitored, or registered nowhere.
See all of it on your own database.
Licensed per engine x databases. First findings in about 30 seconds.